
Options Trading Risk Management: Position Sizing, Drawdowns, Portfolio Diversification
You can’t know for sure whether your next trade will make money, but you can decide how much you’re willing to risk on it. That’s where risk management comes in. It helps you protect your account so you still have capital for the next trade.
In this article, you’ll learn how risk management applies to options trading and why diversification matters for protecting your capital.
Build a risk management plan before you trade
Risk management is more than setting a limit on one trade. It requires a plan for how you use your capital and how much you can afford to lose across several trades.
You may have tested your strategy over hundreds of trades and found it profitable. You know its historical win rate, average gains, and average losses. But those results won’t tell you which trade will win next. Risking too much on a losing trade can wipe out the profits from several winners.
That’s why you need consistent rules. Keep your risk small enough to withstand several consecutive losses and give your strategy time to perform across a series of trades.
Your plan should cover the following points.
Trading capital: How much money will you commit to options trading?
Trading frequency: How many trades do you expect to take each month?
Risk per trade: An example range is 1%–3% of account equity, with 3% as the maximum per trade. Reserve the higher end for high-quality setups that meet all your strategy’s rules.
Risk per stock or market: Set a combined limit for positions exposed to the same stock, sector, or market.
Total portfolio risk: Decide how much you’re willing to risk across all positions.
Monthly loss limit: Set a threshold at which you’ll pause new trades and review your results.
How to calculate risk in options trading
When you buy a call or put, your maximum loss on the option is the premium paid, plus fees. Calculate that cost before entering to check whether the trade fits your risk limit.
Let’s suppose you have a $20,000 account and decide to risk up to 2% per trade. That gives you a maximum budget of $400.
Suppose NVIDIA shares trade at $150 and you expect them to rise. You buy one call contract with a $155 strike price and 45 days until expiration. The strike gives you the right to buy the shares at $155.
You pay a premium of $3.80 per share. Since the standard contract covers 100 shares, your cost is:
$3.80 × 100 = $380
Allowing $4 for estimated fees brings your budgeted risk to $384, or 1.92% of your account, within your $400 limit.
What could happen to this trade?
The following outcomes are before fees:
You close at a profit on expiration day: For example, NVIDIA reaches $180, and you sell your $155 call for $25 per share, receiving $2,500. Subtracting the $380 premium gives you a $2,120 profit, equivalent to 10.6% of your starting capital.
You close at a loss before expiration: NVIDIA falls and your call’s premium drops to $2.00. Selling the contract returns $200, leaving a $180 loss, or 0.9% of your starting capital.
The call expires worthless: NVIDIA finishes at or below $155 at expiration. You lose the full $380 premium, or 1.9% of your starting capital.
Your breakeven at expiration is $158.80 before fees, calculated by adding the $3.80 premium to the $155 strike. The stock must finish above that price for the expiration payoff to exceed what you paid.
Before expiration, time remaining and changes in implied volatility also affect the call’s value. An in-the-money call held into expiration may be exercised automatically under your broker’s procedures, creating a stock position with separate funding requirements and loss exposure. Check those procedures and exercise deadlines before holding the option into expiration.
How does risk change when you sell options?
For a vertical credit spread, calculate the difference between the strikes, subtract the credit received, and multiply by the contract’s share multiplier.
For example, selling a $100 put and buying a $95 put with the same expiration creates a $5-wide spread. If you collect $1.40 per share, the maximum loss at expiration is ($5 − $1.40) × 100 = $360 before fees. Allowing $4 for fees gives you a $364 risk budget. This assumes both legs are managed and settled as intended.
Selling an uncovered option requires a different assessment. Losses can substantially exceed the premium received, and an uncovered call has theoretically unlimited loss potential. Check the position’s downside exposure and buying-power requirements before deciding its size.
For a closer look at how position sizing affects your risk and returns, read SteadyOptions’ position sizing guide.
How to measure drawdowns and manage a losing period
A drawdown measures how far your account has fallen from its previous highest value. Maximum drawdown is the largest such decline over the period you’re measuring. Include open-position gains and losses when tracking account equity, so trades you haven’t closed are reflected in the calculation.
Suppose an account reaches $52,000 and then falls to $47,840. That is a $4,160 decline.
$4,160 ÷ $52,000 × 100 = 8% drawdown
Recovering requires an 8.70% gain from $47,840 to return to $52,000. The recovery percentage is larger because you’re earning it on a smaller balance. A 20% drawdown requires a 25% recovery, while a 50% drawdown requires a 100% gain.
This is why your plan needs a response to losses before they happen. For example, you could halve your usual risk on new trades once the account falls 5% from its peak. If you normally risk 2%, that would reduce your limit to 1%.
At a $49,400 account value, the reduced budget would be $494 per trade. Using current equity also brings the dollar amount down as your account declines.
You could set another threshold, such as an 8% drawdown, to pause new entries and review your results. These percentages are example rules you can adapt to your strategy.
During that review, check whether the losses came from normal losing trades, several positions moving against you together, higher trading costs, or departures from your rules. Continue managing existing positions according to their exit plans. Pausing new entries still leaves those positions exposed to further losses.
Track equity at a consistent time each day and account for deposits and withdrawals when measuring performance. Daily observations can miss a deeper loss that occurred during the session.
How slippage and fees affect your returns
The price shown on your screen can differ from the price you actually trade at. Wider bid and ask quotes can increase that difference, and fees reduce what you keep. OIC explains how order type and quote width affect execution.
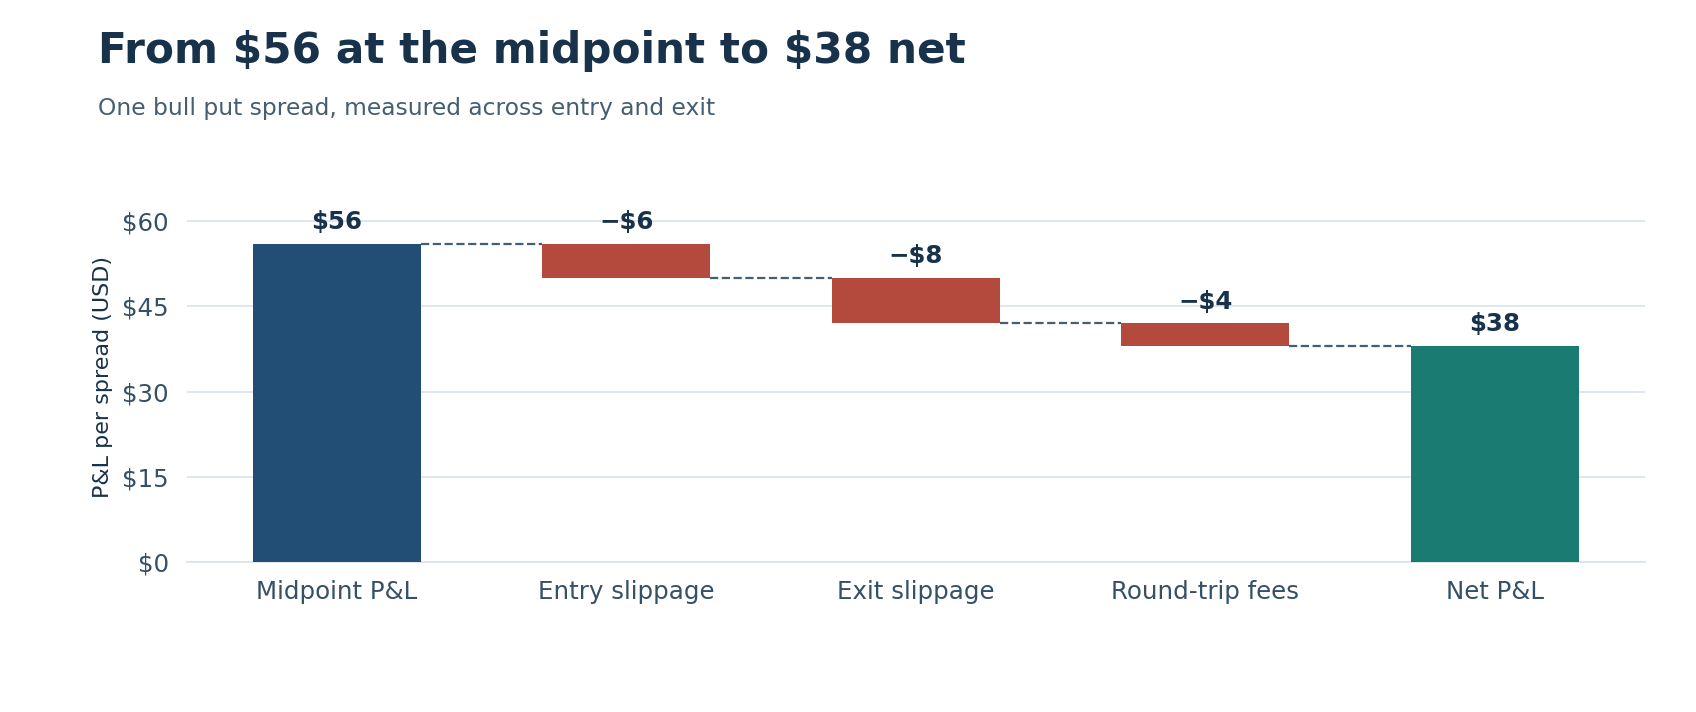
Consider a separate example using one credit spread. You receive a premium when opening the spread and pay to buy it back when closing it.
At entry, its bid is $1.40 and its ask is $1.52. The midpoint is $1.46, but you receive a $1.40 credit.
At exit, its bid is $0.82 and its ask is $0.98. The midpoint is $0.90, but you pay $0.98 to close.
Using midpoint prices, the profit would appear to be $56. Your actual fills produce $42 before fees.
Execution differences and fees reduce the midpoint result by $18, or about 32%. The midpoint serves as a comparison price here. An order placed there may remain unfilled.
Use limit orders to set the price you’ll accept. For a spread, a combined order lets you specify the net credit or debit for both legs. If it remains unfilled, review the quotes and recalculate the trade before changing your limit. Limit orders control the acceptable execution price, while leaving the possibility that the order will not execute.
Record the quotes, actual fills, fees, and reason for exiting in your trading journal. Those records help you see whether execution costs are consistently taking more out of your returns than you allowed for.
Plan your exit before expiration
A stop order sets a trigger price. Once triggered, a stop-market order can execute at a worse price than expected. A stop-limit order controls the acceptable price but can remain unfilled. Check which orders your broker supports for options and spreads.
If you plan to trade outside the regular session, read SteadyOptions’ overview of expanded trading hours for select equity options and confirm access with your broker.
Short equity options also carry assignment risk. Assignment on one leg of a spread can create a stock position that needs attention while the other option remains open. Near expiration, a stock trading around your short strike can leave uncertainty about assignment, often called pin risk. Decide beforehand whether you’ll close the spread or handle the resulting shares, and check your broker’s exercise deadlines.
How to spot correlated positions
Start by grouping positions that could lose money from the same market move. Calls on NVIDIA and AMD both expose you to a tech selloff. A call on a tech ETF can add to that exposure if the fund holds those companies.
Check the ETF’s holdings and compare how your underlying stocks have behaved during past selloffs. Different sector labels can still hide businesses that respond to the same economic conditions.
Then add up the potential losses across each group. If you risk 2% on each of three tech trades, you have 6% of your account exposed if all three reach their maximum loss. Each trade may fit your individual limit while their combined exposure exceeds your sector limit.
Before adding another position, ask what happens to your existing trades if its underlying falls sharply. If several would suffer together, include them in the same risk assessment.
Check shared options exposures
Your options can also share risks through their Greeks. Use them to check what could hurt several positions together.
Delta: Check whether most positions benefit from rising stock prices. Buying calls across several sectors can still leave much of your portfolio vulnerable to a broad market decline.
Gamma: Identify positions with negative gamma, particularly near their strikes and close to expiration. Their directional exposure can increase as prices move against them. Several such positions on correlated stocks deserve particular attention.
Vega: Check what falling implied volatility would do to each position. If most would lose value, you have shared volatility exposure even when the underlying companies operate in different sectors.
Use those checks when deciding whether another trade fits your portfolio and how much risk to allocate to it.
Portfolio diversification
Diversification means spreading your investments across different companies, sectors, or assets to reduce the damage a loss in one area can do to your portfolio.
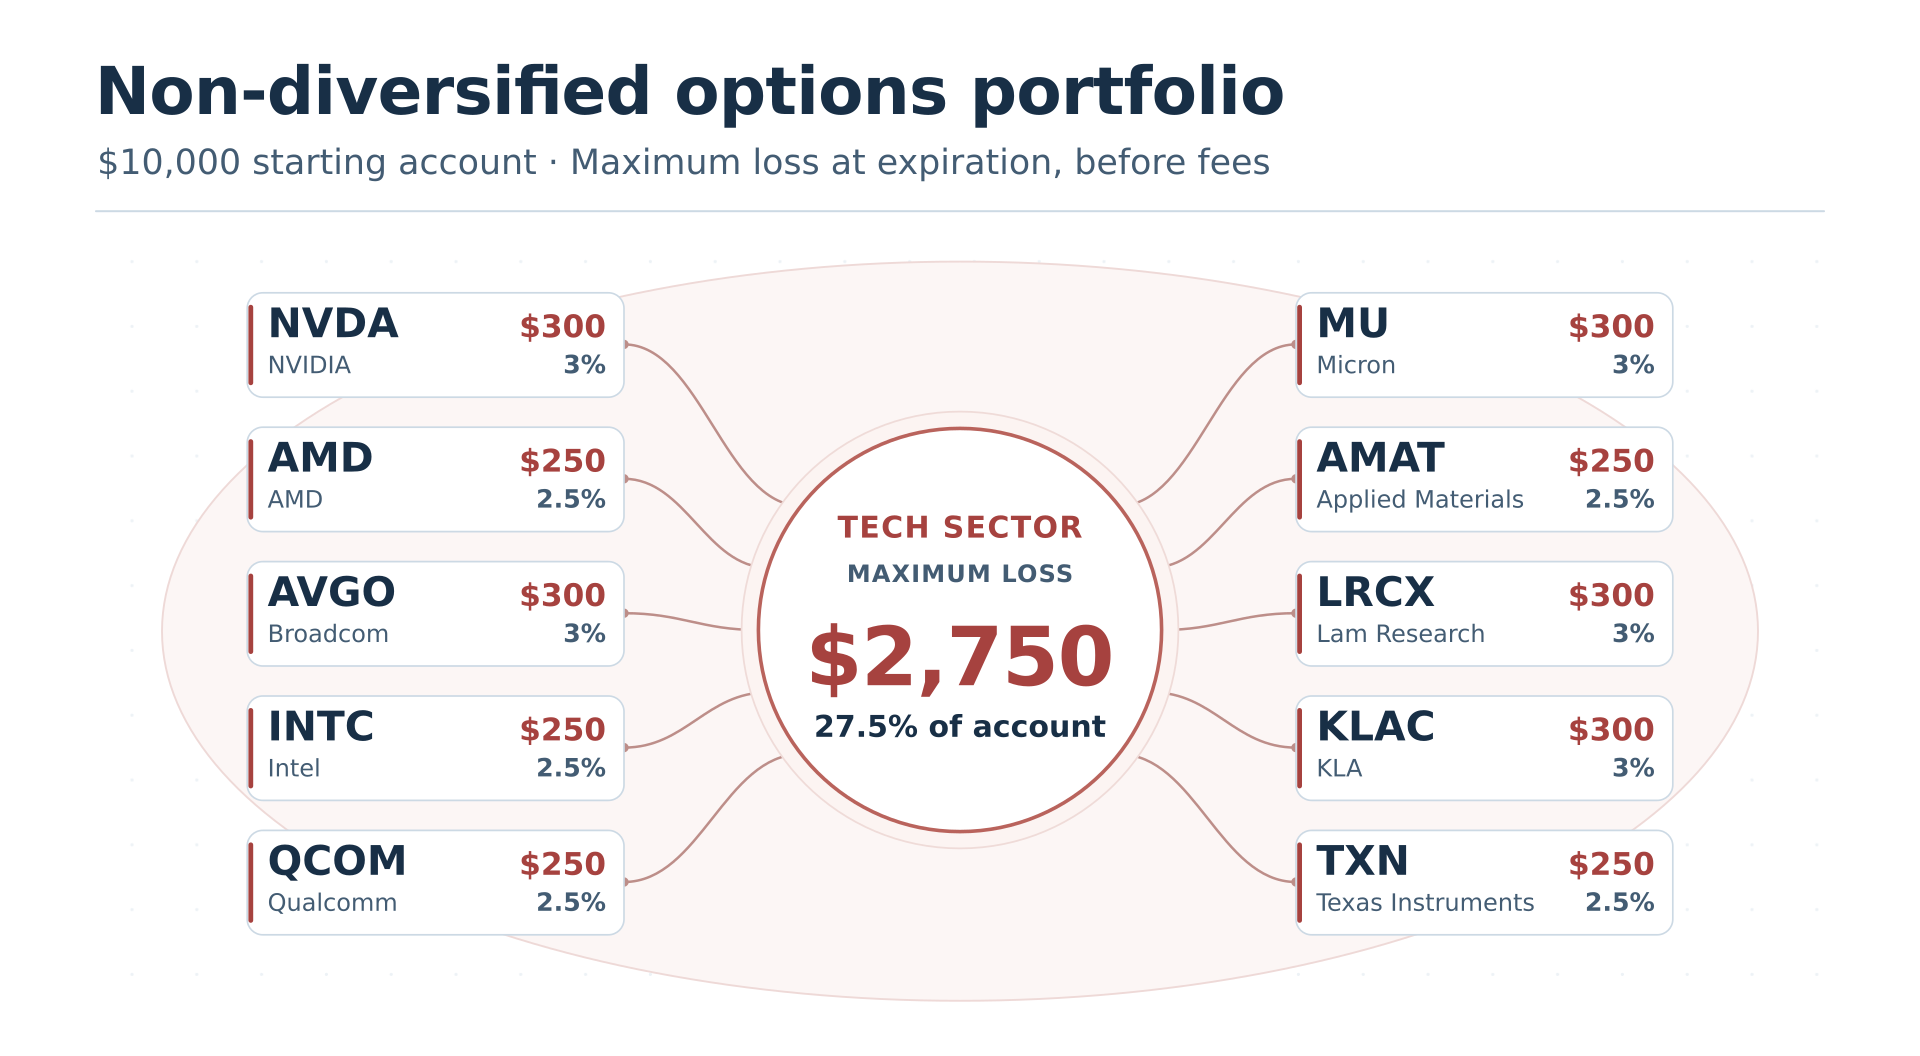
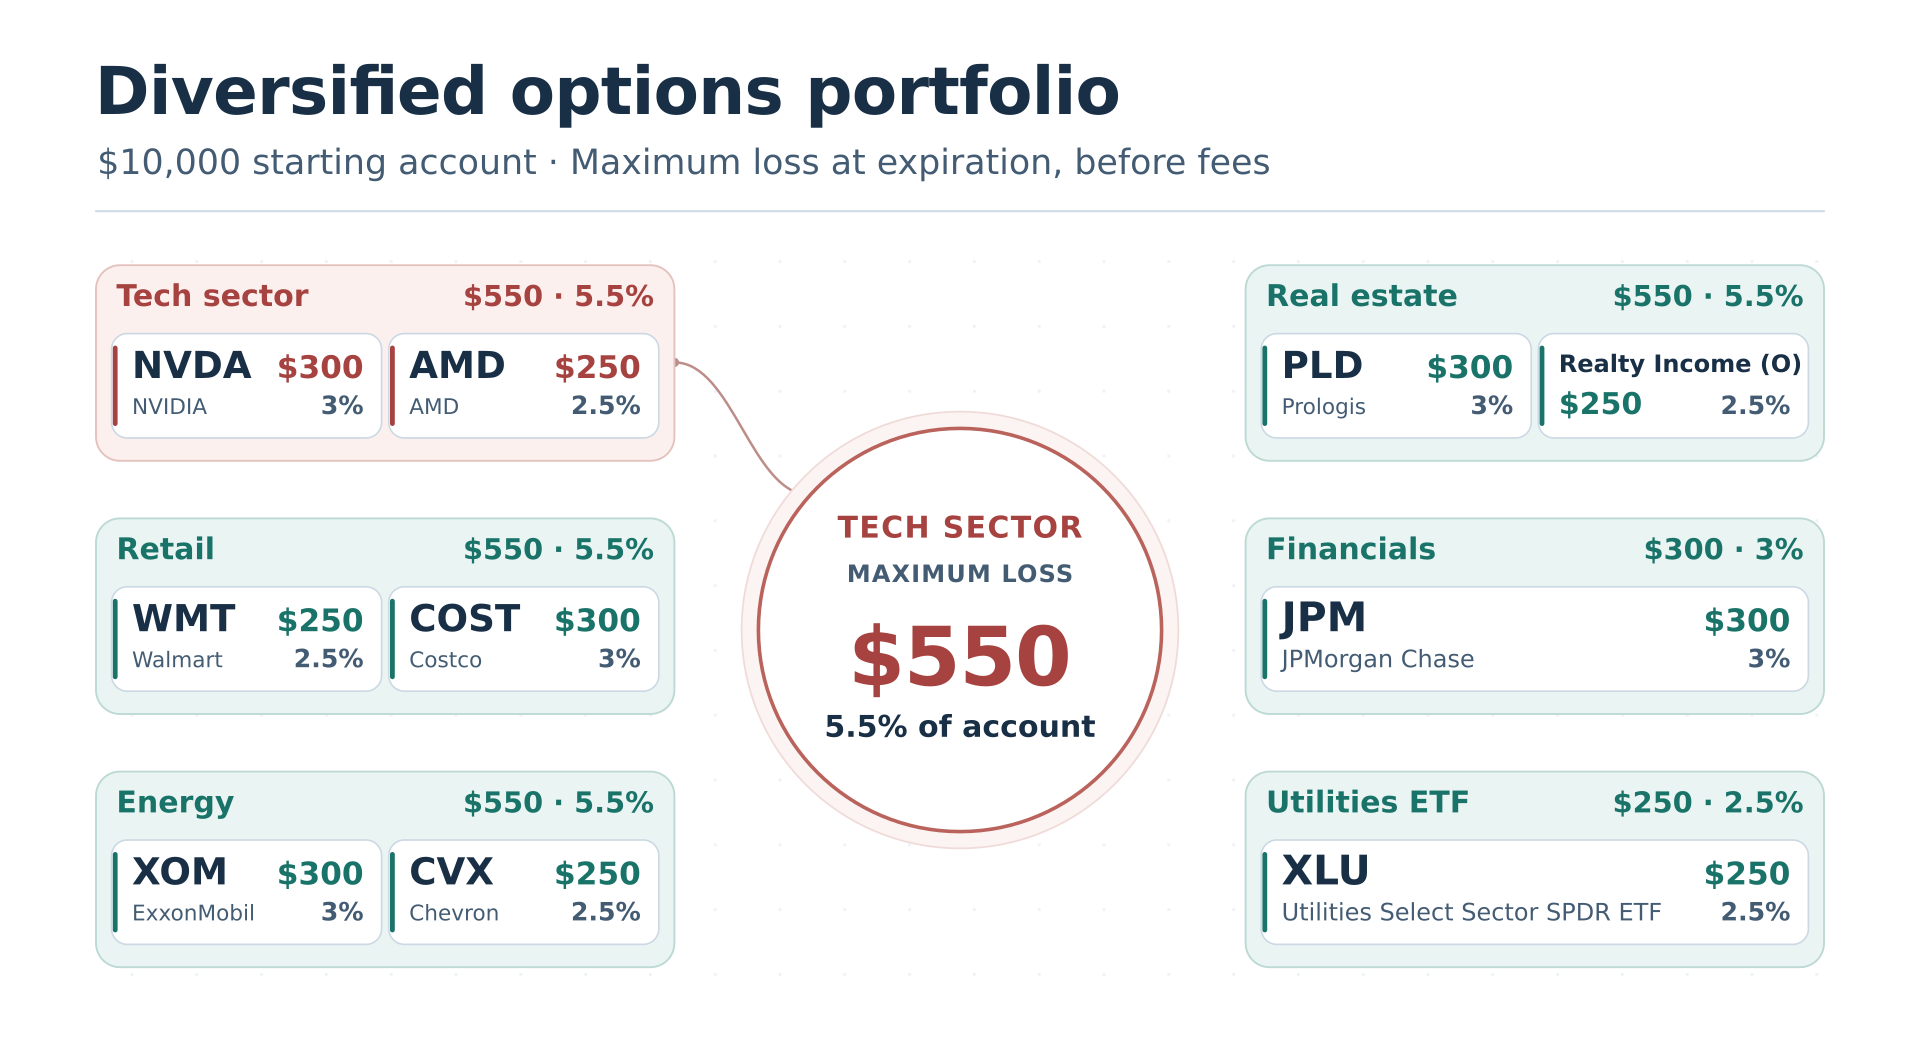
Each ticker in the visuals represents an option bought on that stock or ETF. The dollar amount is the premium paid, and the percentage shows its share of the $10,000 starting account. If the option expires worthless, you lose the full premium. All figures are before fees.
Example 1 · Non-diversified options portfolio
You start with a $10,000 account and buy calls on ten tech stocks. You pay $250 for five positions and $300 for the other five. If all ten calls expire worthless, you lose $2,750, or 27.5% of your starting account.
Suppose tech stocks sell off sharply before the options expire. If the calls lose 60% of their combined value, your account is down $1,650, or 16.5%.
Example 2 · Diversified options portfolio
You spend the same $2,750 in premiums. This time, $550 goes into tech calls, with $300 on NVIDIA and $250 on AMD. You spread the remaining $2,200 across eight options positions in retail, energy, real estate, financials, and utilities.
Assume those eight positions hold steady. If both tech calls expire worthless, your account loses $550, or 5.5%. In the same sharp tech selloff, if the two calls lose 60% of their combined value, your account is down $330, or 3.3%.
Why diversification matters
Diversification helps protect your capital when you hold positions with low correlation. These positions tend to respond to different market forces, so an event that hits tech can leave other parts of your portfolio relatively steady. If some of those positions gain value, their gains can offset part of the tech losses. That limits the damage a single sector can do to your account and leaves more capital for future trades.
Both portfolios could still lose the full $2,750 if every option expires worthless. The comparison shows how spreading exposure across sectors can reduce the damage from a selloff confined to tech, assuming the other positions hold steady.
Final thoughts
Before your next trade, check how much you could lose, how that loss would affect your account, and whether your existing positions share the same risks. Follow the exit and drawdown rules you set in advance, and evaluate your results after trading costs.
Explore SteadyOptions membership for options education, trade ideas, and examples of how traders plan and manage their positions.
FAQ
Should I size a covered-call trade using only the premium I receive?
No. Include the value and downside risk of the shares you own. The premium provides a limited cushion against a decline; it does not cap your stock losses. A small premium can accompany a much larger capital exposure.
How should I track my results when I roll a losing option?
Record the closed position’s realized loss separately from the replacement trade. Receiving a net credit when rolling does not erase that loss. Evaluate the new position’s potential loss, expiration, and capital requirements before deciding whether to continue.
What extra risk am I accepting by holding a purchased option through earnings?
You face both an unpredictable stock-price reaction and a possible drop in implied volatility after the announcement. Your option can lose value even if the stock moves in your favor. Decide before the report whether your strategy justifies accepting those risks.
About the author: Naoufal Seddik is a trader and financial writer with over six years of experience in financial markets. He covers forex, indices, stocks, and commodities. He works with the editorial team to create clear, accurate trading and investing content for readers of all experience levels. He is also a Top Rated Plus freelancer on Upwork.
Upwork profile:
https://www.upwork.com/freelancers/~01900fde01a206f244